

안녕하세요?
1편에 이어 2편에서 자바스크립트로 웹 스크래핑하는 방법에 대해 알아 보겠습니다.
자바스크립트 웹 스크래핑 맛보기
안녕하세요? 오늘은 웹 스크래핑 (web scrapping)에 대해 알아보겠습니다. 웹 스크래핑이 왜 필요할까요? 대학 과제나 회사 업무에서 간혹 기초 자료가 필요한 경우가 있습니다. 이럴때 보통 구글 검
cpro95.tistory.com
1편 마지막에서 문제점이 발생됐는데요, 모든 차종 개수와 판매대수 개수가 틀립니다.
다른 차종의 판매대수 css 클래스는 "total_num"인데,
"버스/트럭 (현대)" 차종은 판매대수의 css 클래스가 "total_num"이 아닌 그냥 "num"입니다.
그 외 "카운티", "더 뉴 G70", "GV70" 모두 css 클래스가 "total_num"이 아니고 그냥 " num"으로 나옵니다.
다나와오토 페이지의 개발자가 좀더 규칙적으로 사이트를 만들었으면 싶은데 조금 아쉽네요.
수작업없이 깔끔하게 원하는 기초 자료를 수집할려고 했는데 몇몇 아이템은 결국에는 수작업으로 처리해야 하나 걱정입니다.
이렇게 수작업 할꺼면 진정한 개발자라고 할 수 없죠.
다른 방법을 생각해 봅시다.
일단 다나와오토 사이트를 다시 살펴봅시다.
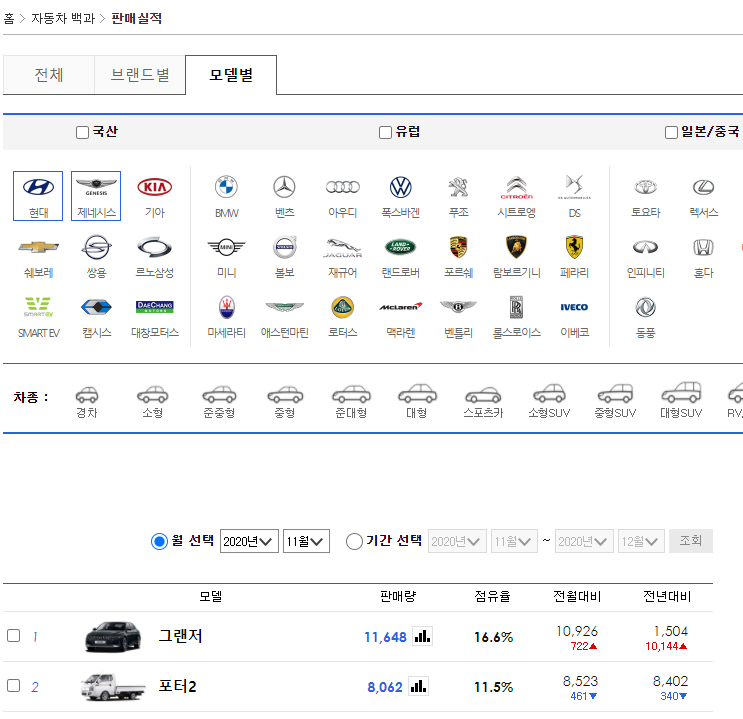
중간에 라디오버튼중에 "월 선택"이 있고 "기간 선택"이 있는데, 1편에서는 "기간 선택"을 했었는데,
2편에서는 "월 선택"을 하고 HTML 소스를 살펴보겠습니다.
<table class='recordTable model' cellspacing='0'>
<caption>모델별 판매실적</caption>
<colgroup>
<col class='check'>
<col class='rank'>
<col class='more'>
<col width='*'>
<col class='count'>
<col class='rate'>
<col class='comp'>
<col class='comp'>
</colgroup>
<thead>
<tr>
<th colspan='3'> </th>
<th scope='col'>모델</th>
<th scope='col'>판매량</th>
<th scope='col'>점유율</th>
<th scope='col'>전월대비</th>
<th scope='col'>전년대비</th>
</tr>
</thead>
<tbody>
<tr>
<td><input type='checkbox' name='compItemCk' value='record_3737' title='그랜저' brand='303'></td>
<td class='rank'>1</td>
<td></td>
<td class='title'>
<a href='/newcar/?Work=estimate&Model=3737'>
<img src='http://autoimg.danawa.com/photo/3737/model_200.png' onerror="imageError(this, 'model_200_100.png')" alt='그랜저'>
그랜저
</a>
</td>
<td class='num'>11,648<button type='button' class='viewGraph' name='viewGraph' val='3737' brand='303'><span class='screen_behind'>그래프로 보기</span></button></td>
<td class='rate right'>16.6%</td>
<td class='right'>10,926<span class='up'>722▲</span></td>
<td class='right'>1,504<span class='up'>10,144▲</span></td>
일단 '그랜저' 부분의 자료입니다. 차종은 1편과 마찬가지로 td tag의 css 클래스 title 밑에 a tag 에 있습니다.
판매 대수는 td 태그의 css 클래스 num에 있습니다.
그러면 1편에서 문제가 됐던 "버스/트럭 (현대)" 차종을 살펴 볼까요?
<tr>
                        <td><input type='checkbox' name='compItemCk' value='record_3039999' title='버스/트럭 (현대)' brand='303'></td>
                        <td class='rank'>11</td>
                        <td></td>
                        <td class='title'>
                            <a href='/newcar/?Work=estimate&Model=3039999'>
                                <img src='http://autoimg.danawa.com/photo/3039999/model_200.png' onerror="imageError(this, 'model_200_100.png')" alt='버스/트럭 (현대)'>
                                버스/트럭 (현대)
                            </a>
                        </td>
                        <td class='num'>2,431<button type='button' class='viewGraph' name='viewGraph' val='3039999' brand='303'><span class='screen_behind'>그래프로 보기</span></button></td>
                        <td class='rate right'>3.5%</td>
                        <td class='right'>1,922<span  class='up'>509▲</span></td>
                        <td class='right'>2,148<span class='up'>283▲</span></td>
                    </tr>
똑같이 td tag의 css 클래스 'num' 밑에 있습니다.
일단 조짐이 좋아 보입니다. 여기까지 코드랑 실행결과를 보겠습니다.
const axios = require('axios');
const cheerio = require('cheerio');
let url = "http://auto.danawa.com/auto/?Work=record&Tab=&Brand=303,304&Month=2020-11-00&MonthTo=";
axios.get(url)
.then(html => {
const $ = cheerio.load(html.data);
var nameArr = [];
$('table.recordTable')
.find('tbody tr')
.find('td.title')
.find('a')
.each((i, el) => {
nameArr.push(
$(el).text()
.replace(/\n/g, '')
.replace(/ /g, '')
);
});
var numberArr = [];
$('table.recordTable')
.find('tbody tr')
.find('td.num')
.each((i, el) => {
numberArr.push(
$(el).text()
.replace(/\n/g, '')
.replace(/ /g, '')
);
});
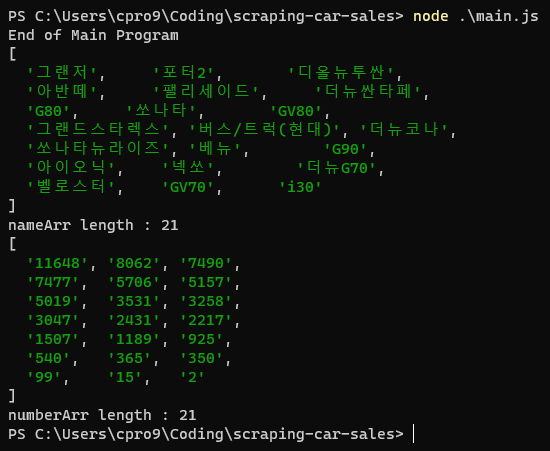
console.log(nameArr);
console.log("nameArr length : " + nameArr.length);
console.log(numberArr);
console.log("numberArr length : " + numberArr.length);
})
.catch(error => console.error(error));
console.log("End of Main Program");

와우! 차종 개수와 판매대수 개수가 동일합니다.
실제 체크해보면 순서도 딱 맞습니다.
코드 설명은 1편에서 했기 때문에 건너뛸 예정이며,
판매대수를 보시면 "11,648그래프로보기" 이렇게 되어 있는데 원인은 다음과 같습니다.
 <td class='num'>2,431
     <button type='button' class='viewGraph' name='viewGraph' val='3039999' brand='303'>
        <span class='screen_behind'>그래프로 보기</span>
    </button>
</td>
td 태그 밑에 button, span 태그가 있어서 그렇습니다.
우리는 숫자만 원하기 때문에 이걸 지워야 되겠죠? 코드를 바꿔 보겠습니다.
var numberArr = [];
        $('table.recordTable')
            .find('tbody tr')
            .find('td.num')
            .find('button')
            .empty()
            .parent()
            .each((i, el) => {
                numberArr.push(
                    $(el).text()
                        .replace(/\n/g, '')
                        .replace(/,/g, '')
                );
            });
td.num을 find하면 아래 전체가 선택됩니다.
 <td class='num'>2,431
     <button type='button' class='viewGraph' name='viewGraph' val='3039999' brand='303'>
        <span class='screen_behind'>그래프로 보기</span>
    </button>
</td>
그러면 우리는 td 밑에 있는 button 태그를 삭제하면 됩니다.
그리고 다시 상위 tag로 가면 됩니다.
.find('button')
.empty()
.parent()
button 태그를 선택했다가 empty()로 그 버튼 태그를 삭제하고 다시 parent 태그를 쓰면 td.num 태그가 됩니다.
그러면 우리가 원하는 숫자만 나옵니다.
그리고 숫자 자리수 ','를 삭제할려면 아래와 같이 치환 연산자를 쓰면 됩니다.
.replace(/,/g,'')
자 이제 결과를 보실까요?
아주 깔끔하게 나왔습니다.
자, 그러면 여기서 개발자라면 위 결과로 나온 데이터를 단순히 복사해서 수작업 할 수는 없겠죠?
명색이 개발자인데요.
그리고 2020년 11월 데이터만 뽑았는데 2020년 전체를 뽑고 싶을때는 어떻게 해야 할까요?
여기서 NodeJS 세계에서 유명한 SheetJS라는 엑셀 조작 모듈을 사용해서 위에 데이터를 엑셀에 옮기겠습니다.
https://github.com/SheetJS/sheetjs
SheetJS/sheetjs
:green_book: SheetJS Community Edition -- Spreadsheet Data Toolkit - SheetJS/sheetjs
github.com
우리 개발 폴더에서 위 모듈을 설치해 보겠습니다.
npm install xlsx --save
SheetJS는 사용법이 어려워서 일단 우리가 원하는 데이터를 엑셀시트에 저장만 하겠습니다.
원하는 데이터를 추출해서 엑셀에 옮기는 것이야 말로 데이타 수집의 끝 아닐까요?
일단 완성된 코드를 보겠습니다.
const axios = require('axios');
const cheerio = require('cheerio');
const XLSX = require('xlsx');

// let url = "http://auto.danawa.com/auto/?Work=record&Tab=&Brand=303,304&Month=2020-11-00&MonthTo=";


// global variable for excel output
var ws_data = [];

// main execution
for (i = 1; i < 12; i++) {
    let month = '';
    if (i < 10) {
        month = '2020-0' + i;
    } else {
        month = '2020-' + i;
    }

    let url = 'http://auto.danawa.com/auto/?Work=record&Tab=Model&Brand=303,304,307&Month=' + month + '-00';

    axios.get(url)
        .then(html => {
            const $ = cheerio.load(html.data);

            var nameArr = [];
            $('table.recordTable')
                .find('tbody tr')
                .find('td.title')
                .find('a')
                .each((i, el) => {
                    nameArr.push(
                        $(el).text()
                            .replace(/\n/g, '')
                            .replace(/ /g, '')
                    );
                });

            var numberArr = [];
            $('table.recordTable')
                .find('tbody tr')
                .find('td.num')
                .find('button')
                .empty()
                .parent()
                .each((i, el) => {
                    numberArr.push(
                        $(el).text()
                            .replace(/\n/g, '')
                            .replace(/,/g, '')
                    );
                });

            console.log(nameArr);
            console.log("nameArr length : " + nameArr.length);
            console.log(numberArr);
            console.log("numberArr length : " + numberArr.length);

            var car_result = {};
            car_result.nameArr = nameArr;
            car_result.numberArr = numberArr;
            return car_result;
        })
        .then(res => {
            for (var i = 0; i < res.nameArr.length; i++) {
                var imsiArr = [];
                imsiArr.push(res.nameArr[i]);
                imsiArr.push(res.numberArr[i]);
                imsiArr.push(month);
                ws_data.push(imsiArr);
            }

            // save to excel file
            var wb = XLSX.utils.book_new();
            wb.SheetNames.push("CarSales");
            var ws = XLSX.utils.aoa_to_sheet(ws_data);
            wb.Sheets["CarSales"] = ws;
            XLSX.writeFile(wb, 'car_sales.xlsx');

        })
        .catch(error => console.error(error));
}

console.log("End of Main Program");
추가된 코드 부분만 살펴보겠습니다.
// global variable for excel output
var ws_data = [];

// main execution
for (i = 1; i < 12; i++) {
    let month = '';
    if (i < 10) {
        month = '2020-0' + i;
    } else {
        month = '2020-' + i;
    }

    let url = 'http://auto.danawa.com/auto/?Work=record&Tab=Model&Brand=303,304,307&Month=' + month + '-00';
엑셀에 데이터를 넣기 위해서 ws_data라는 글로벌 변수로 설정했습니다.
그리고 2020년 1월부터 11월까지 데이터를 추출해야 해서 for 루프문을 만들었습니다.
그리고 url을 해당 월에 맞게 수정하는 코드를 추가했습니다.
다음은 엑셀에 저장하는 코드입니다.
            // save to excel file
            var wb = XLSX.utils.book_new();
            wb.SheetNames.push("CarSales");
            var ws = XLSX.utils.aoa_to_sheet(ws_data);
            wb.Sheets["CarSales"] = ws;
            XLSX.writeFile(wb, 'car_sales.xlsx');
위 코드를 보시면 XLSX유틸로 book을 새로 만들고 (wb),
wbSheetNames.push로 시트 "CarSales"를 만듭니다.
그리고 위에 글로벌하게 저장된 ws_data를 XLSX.utils.aoa_to_sheet 함수를 통해 ws라는 이름으로 저장합니다.
그리고 wb.Sheets["CarSales"] 에 ws를 저장합니다.
마지막으로 XLSX.wirteFile 함수로 워크북 wb를 "car_sales.xlsx"라는 이름으로 저장합니다.
꽤 직관적이며 헷갈리는데요, 상세 함수는 SheetJS 홈페이지를 참고 바라며, 나중에 더 블로깅하겠습니다.
일단 SheetJS는 다차원 배열을 엑셀로 쉽게 전환시켜 줍니다.
예를 들어
[
["사과", "바나나", "망고"],
["컴퓨터", "노트북", "핸드폰"]
]
이렇게 되어 있으면 엑셀에서는 각각
A1 B1 C1
A2 B2 C2
에 저장됩니다.
우리가 원하는 차종이름과 판매대수, 그리고 해당 Month를 각각의 배열에 넣는 코드가 다음과 같습니다.
for (var i = 0; i < res.nameArr.length; i++) {
                var imsiArr = [];
                imsiArr.push(res.nameArr[i]);
                imsiArr.push(res.numberArr[i]);
                imsiArr.push(month);
                ws_data.push(imsiArr);
            }
자, 이제 실행후 엑셀 화면을 보여드리겠습니다.
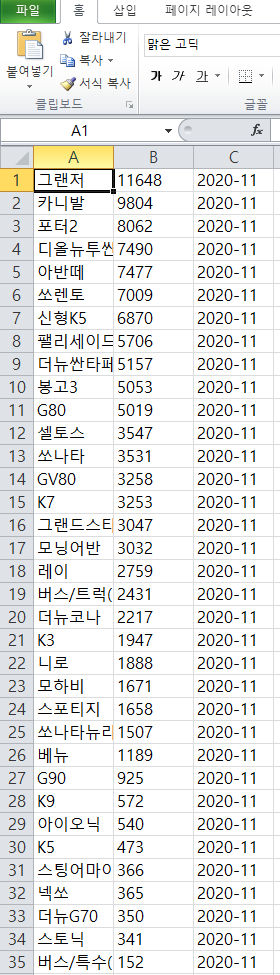
위 엑셀을 스크롤 하면 1월부터 데이터가 축적되었음을 확인할 수 있습니다.
자 Raw Data가 모였으니 이제 엑셀 피벗을 돌리거나 챠트를 그리거나 여러분의 목적에 맞게 작업을 하시면 됩니다.
이상 웹 스크래핑으로 귀찮은 데이터 수집 및 엑셀 저장에 대해 알아 보았습니다.
끝.
'코딩 > Javascript' 카테고리의 다른 글
| [JS-기초편] 2.변수(variable)와 값(value) (0) | 2020.12.14 |
|---|---|
| [JS-기초편] 1.소개 (0) | 2020.12.13 |
| 자바스크립트 웹 스크래핑 맛보기 (0) | 2020.12.12 |
| 자바스크립트 fetch를 이용한 비동기 및 동기방식 프로그래밍의 이해 (0) | 2020.12.11 |
| 자바스크립트의 덧셈 연산 완벽 분석 (0) | 2020.12.09 |